
About Snapsheet
Snapsheet is an insurance technology company bringing the future to auto claims processing. The cloud-based technology platform powers customer engagement and intelligent workflows to deliver the best claims experience, driving efficiencies using data and technology.
1 - Overview
Research
Interviews with claim handlers, insurance company stakeholders, and the customer support team.
Shadowing sessions.
Competitive research.
Card sorting.
User journeys.
User case definition.
Ideation
Information architecture.
User flows.
Site map.
Wireframing.
Interaction map.
Tools
Pencil and paper.
White boards.
Sketch.
Lucidchart.
Axure.
Invision.
2 - The brief
Snapsheet is the largest virtual claims technology provider in the world and has handled 1M+ virtual claims for 70+ insurance carriers, such as USAA, Liberty Mutual, MetLife, The Hartford, Aviva, CHUBB, Uber, Lyft, and Metromile.
After the success of their business model, Snapsheet wanted to expand and create the best claim management platform in the market in the format of a SaaS product. Other insurance software platforms require to be installed and constantly updated, a situation that requires a great financial investment and technical support from the insurance companies. Snapsheet wanted to bring the future to the industry and become the best browser-based claim management platform.
3 - Role
My role in the project was Lead Designer. I was mostly involved in the project's research, definition, and ideation. Working closely with the Product Manager and leading three middle-level designers: Rachel Riccardo, Sarah Klimek, and Teron Russell.
4 - Understanding the industry (interview process)
The first step in our research was conducting interviews with claim handlers and industry experts to understand the lifecycle of a claim.
We discovered that the car insurance industry process is very segmented. The whole lifecycle of a claim is divided into five steps: First notice of loss (FNOL), evaluation, negotiation, settlement, and payment. Snapsheet’s business model only covered the transition between FNOL and evaluation.
We used these five steps to create the five phases needed for our product. This would allow us to focus on specific needs per phase.
Lifecycle of a claim
5 - Understanding the industry (shadowing sessions)
The second step to understanding the insurance industry workflow was to conduct shadowing sessions. Snapsheet’s good relationship with leading insurance companies was a great help to cover this need. Apart from shadowing customer support representatives internally, we had the chance to shadow claim handlers, estimators, and negotiators from different insurance companies like USAA, Zurich, and CNA.
These shadowing sessions gave us a lot of qualitative/quantitative information about our users' environment, the software they use, the monitors they use, the operating systems they run their PCs on, etc. After the shadowing sessions with the 20 participants, we reserved 10 minutes at the end of each session to gather their thoughts and pain points about their daily tasks.
Some of the biggest paint points were:
Having to utilize multiple systems to process claims.
Lack of structure in the information displayed.
Lots of clicking and scrolling.
Lack of automation processes.
One of the biggest challenges we found in these shadowing sessions was the inability to record or even take photos of the sessions. The information displayed on the screens was sensitive, and getting graphic material out of the building was completely forbidden.
6 - Building user scenarios
After our shadowing sessions, I was able to start building user scenarios. This was necessary to try and cover possible situations our users might find themselves in while dealing with their daily tasks and also for us to find possible pain points.
7 - Competitive Research
The next step in our research was discovering and comparing what other products exist in the market that already do what we are trying to achieve. This was necessary to avoid reinventing the wheel and build an experience similar to what our customers might already be used to seeing. Another reason was to identify other possible features that might be useful to our product.
Guidewire, Claims IO, and Duck Creek are industry leaders in claim management software. I worked directly with the product manager, testing these three platforms, gathering data, and comparing it to the information we had gathered in previous sessions with users.
8 - Information Architecture
The next step in our process was to put together all the content needed for our pages. This step was a great challenge because claim management involves tons of data from different sources: policyholders, investigators, estimators, body shops, claim handlers, lawyers, doctors, etc.
We decided to divide the information sections into cards. Doing it this way would make guiding the user through this sea of information easier and make all this data easily findable. To divide this information into cards, I designed a card sorting exercise with ten users (not enough, but a great number for a first phase).
After the exercise, I collected the information into an Excel file, analyzed it, and created a possible information architecture for our main page: claim view.


Click image to expand
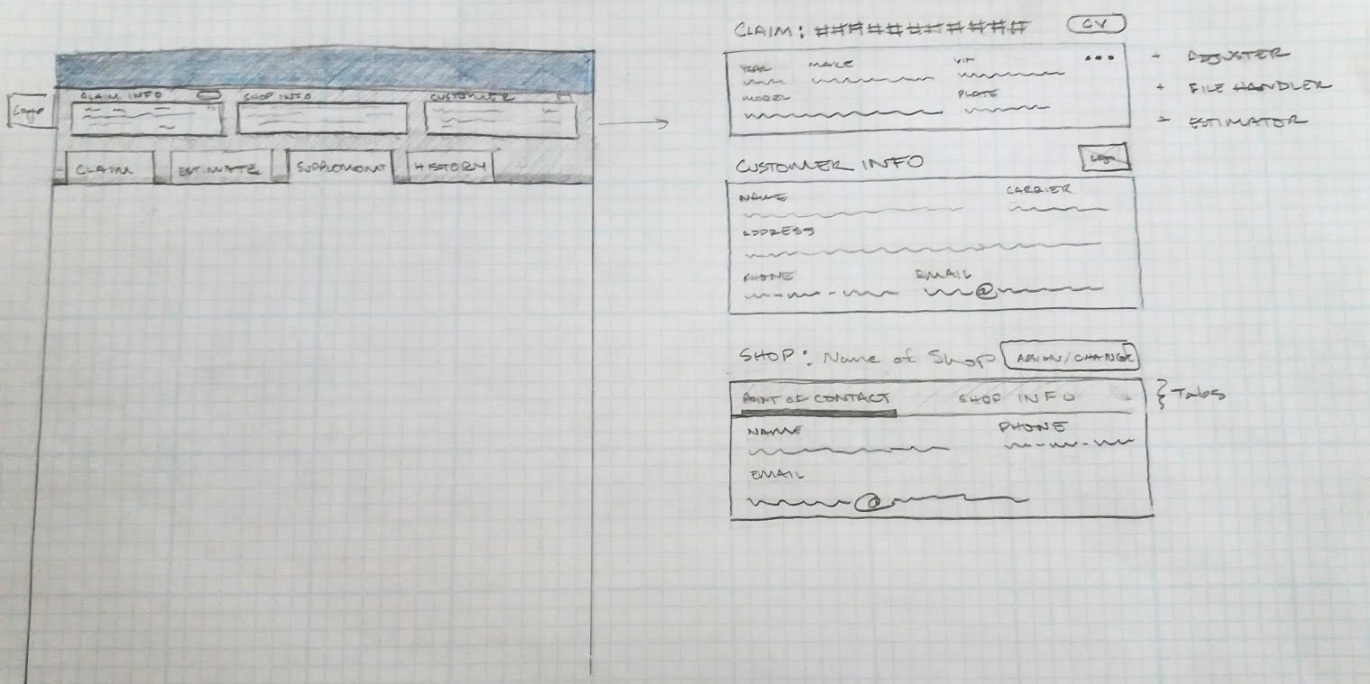
9 - Sketching and prototyping
After the information architecture process, we discovered we should explore using a card-based system for our platform. The benefits of this design are:
Organized content.
Create digestible content.
Easy to use.
Scalable for varying sizes.
10 - Testing, iteration, and results
In our first testing session, we discovered that showing photos on the main page was jeopardizing the amount of content we could show without scrolling. Scrolling was one of our users' main pain points, so we decided to move photos and documents to their own section and leave more space for the information.
The product has been evolving after several iterations, and you can see some of the screens created for this project below.


